High-quality AI image generation

Unleash AI-driven data visualization and analysis, more efficiently, with ChartPixel.
Pricing
Freemium
Category
AI Research
Platforms
Web
Languages
EN, CN
Ready to try ChartPixel?
Open the official ChartPixel website to verify latest features, plans, and product updates.
Multiple artistic styles support
Customizable output parameters
Overview
ChartPixel is a practical AI-powered tool that transforms the way we interact with data. In the digital age, where data is the new currency, ChartPixel stands out as a beacon for those looking to harness the power of their data quickly and effectively. It promises to generate charts and insights within a mere 30 seconds, offering a streamlined solution for data visualization and analysis. Designed for a wide array of users, from students to seasoned professionals, ChartPixel aims to simplify the often complex process of data interpretation.
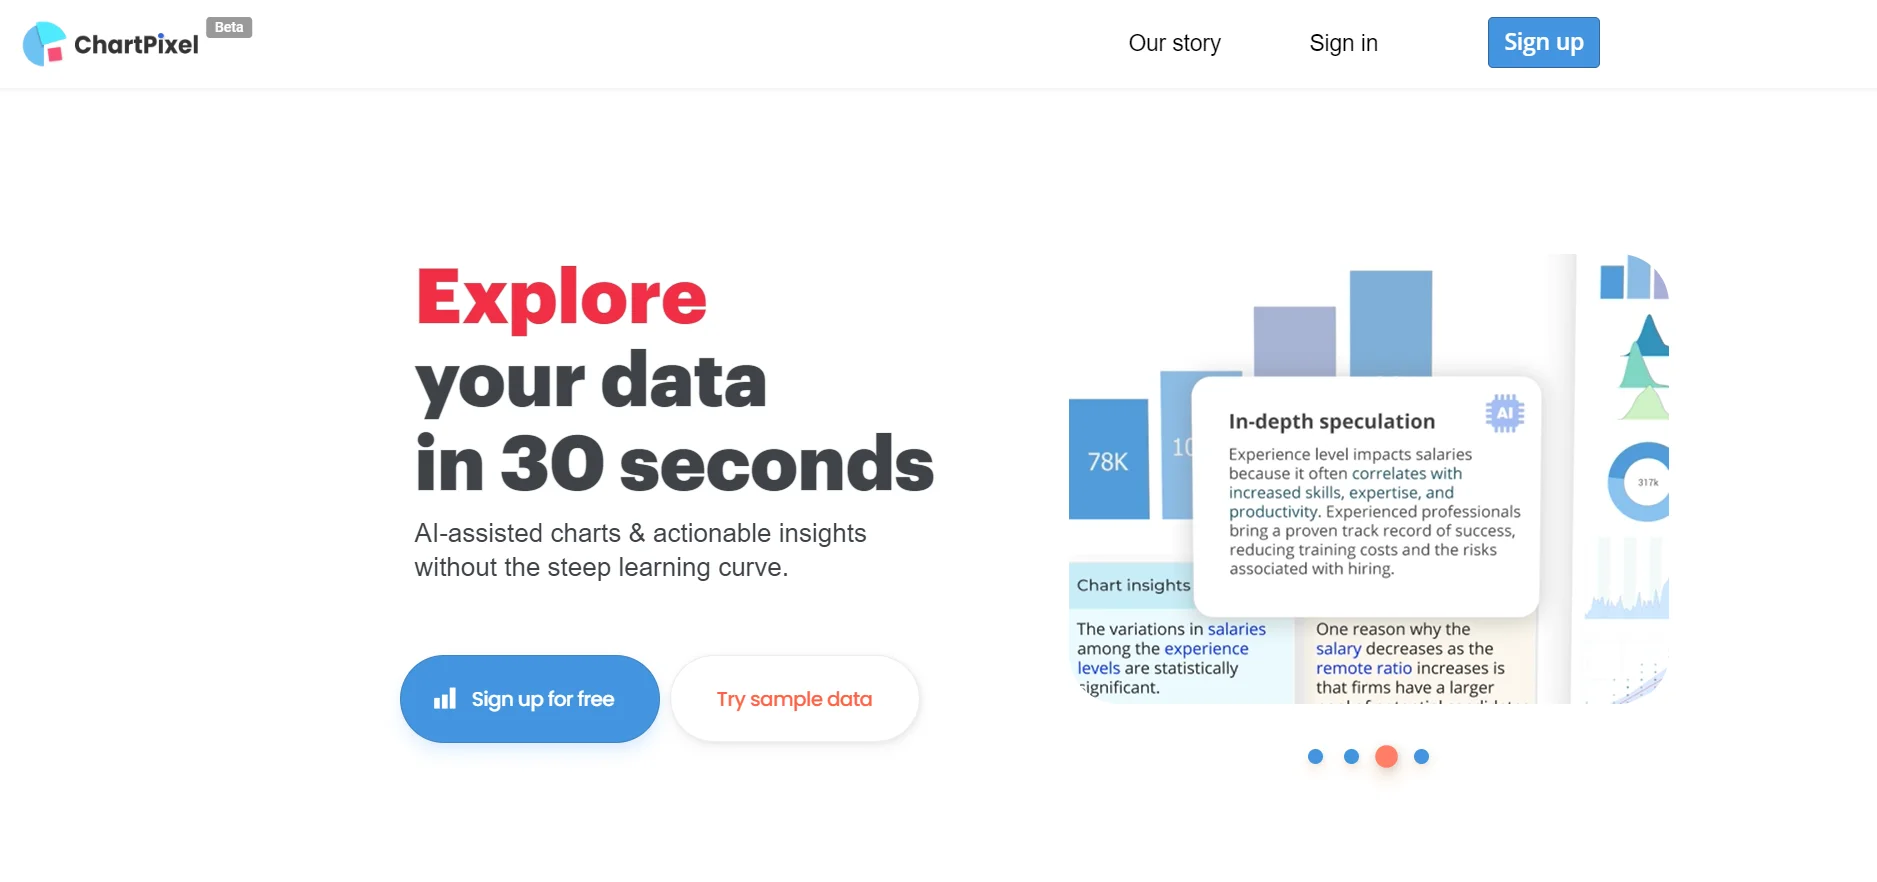
What is ChartPixel? ChartPixel is a practical AI-powered tool that transforms the way we interact with data. In the digital age, where data is the new currency, ChartPixel stands out as a beacon for those looking to harness the power of their data quickly and effectively. It promises to generate charts and insights within a mere 30 seconds, offering a streamlined solution for data visualization and analysis. Designed for a wide array of users, from students to seasoned professionals, ChartPixel aims to simplify the often complex process of data interpretation. Key Features: AI-Assisted Chart Creation: ChartPixel uses artificial intelligence to automatically select the most relevant data columns and chart types, providing meaningful visualizations with minimal user input. User-Friendly Interface: The platform boasts an intuitive interface that caters to users of all skill levels, ensuring that data analysis is accessible and not daunting. Smart Data Cleaning: It takes the hassle out of preprocessing by cleaning messy data and engineering new features for a comprehensive analysis. Insightful Annotations: With AI-assisted annotations and statistics, ChartPixel not only presents data visually but also explains it, making patterns and trends easier to grasp.
Key Features
High-quality AI image generation
Multiple artistic styles support
Customizable output parameters
Image editing and enhancement
Batch processing capabilities
Screenshots
FAQ
Common questions
Use Cases
User Reviews
What users say
No approved reviews yet.
Alternatives to ChartPixel
View allCLEVR AI
Freemium
Monitor, optimize campaigns in real-time, generate detailed visualizations and analytics.
Hanson Robotics Sophia
Freemium
Engage in conversations, gather insights, and provide customer service using Sophia's expressive face.
OptinMagic
Freemium
OptinMagic is a capable lead generation tool that helps businesses convert website visitors into customers.
Daisee Negotiator
Freemium
Automate negotiation, save time, use simple interface, get detailed analytics for informed decisions.
Clever Content
Freemium
Automate content creation, optimize for SEO and social sharing, and track performance with real-time analytics.
Scite
Free
Scite is an AI research tool for reading papers with more context around how studies are cited and discussed.